2. Making Figures
Home | << Previous Page | Next Page >>
Learning Objectives
- Multidimensionality of images and how to work with this
- Begin exploring the ROI manager
- Understand "overlays"
- Adding scale bars
Multidimensional images
The basic dimensions of an image are X and Y, however bioimage data can be far more complex.
We've viewed stack images, these have an extra dimension: channels (aka "slices").
Other dimensions:
- Z-positions moving vertically through the sample, making the image 3D
- Time, e.g. for timelapse videos
- Also XY position of your stage i.e. where on your sample an image is taken. Automated runs of imaging may have multiple locations in the same file
This can make files very large, quite complex and difficult to summarise in 2D!
Exercise 1: Processing multidimensional images
- Open "Mitosis (5D stack)" from the built in images
- Go on, use the search bar!
- This is clearly a more complex image
- This is referred to as a "hyperstack"
- Can you see how many images there are?
- What are the different dimensions involved?
- How might we begin to simplify this image for visualisation?
- Project the signal across the z-planes
- For once it is worth following the tab to see some related options in Image > Stacks
- Many of these functions are relevant and useful to know about
- Select Z-project and Maximum Intensity
- Watch the video again. Isn't that better!?
- Set the brightness and contrast for the image and apply the changes when you're ready
Note: Until you "Apply" changes to brightness these can still change
Note: Always be careful not to override your original raw image. If in doubt, duplicate (Ctrl+Shift+D) the original and close it
- Frames can be trimmed by Duplicating (Ctrl+Shift+D) the image and selecting the frames you want

The ROI Manager
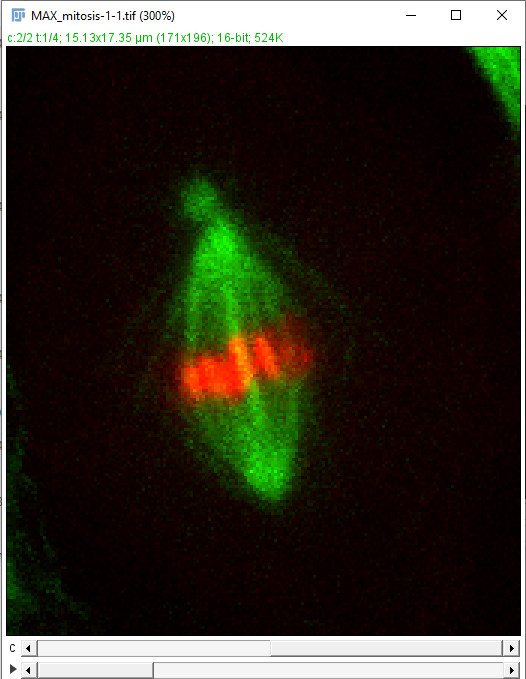
I only want to see the chromosomes in my figure, so want to crop the image.
Cropping and zooming are common steps in figure construction.
It is important that the size and position of the selected region are known and recorded.- Helps to preserve scales and sizes between different images
- Enables repeated selection of a region in different images
This is one of the many uses of the ROI (region of interest) Manager
Exercise 1: Getting started with the ROI Manager
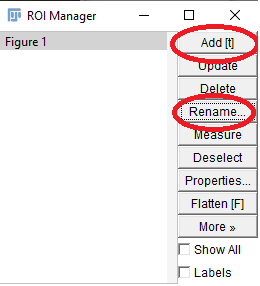
- First, open the ROI manager
- You know what to do, use that search bar!
- regions can be selected using a variety of tools in the toolbar
- Choose the rectangle tool and select your region of interest
- Look through your video. Does everything stay in frame? If not, adjust the roi
- When you're happ with the ROI add it to the ROI manager by pressing "Add"
- See that you can now select a different region in the image and then use the ROI recorded to re-select the original region
- Let's rename the ROI "Figure 1"
- Whole libraries of ROIs can be recorded, saved and revisited in this way
- Crop the image by selectiong this ROI and Duplicating the image
- To make this a colour image we need to convert it to RGB (Image > Type > RGB color)
- Keep the 4 time frames in the image for now
- We can only show one frame at a time, so let's split the frames so they can be shown side by side
- Image > Stacks > Stack to Images
- You'll now have merged colour images of the 4 frames depicting chromosome segregation

Note: To zoom in and out you can use "+" and "-" keys, or the up/down arrows.
- ;

Scale bars
- It's vital to be able to provide the scale of your image in a figure
- This is calculated based on a combination of information about the objective and camera used to capture the image
- Fortunately this information is recognised in this image's metadata, as the scale of the image can be seen in the information above it
- Scale can also be manually set using "Set Scale"
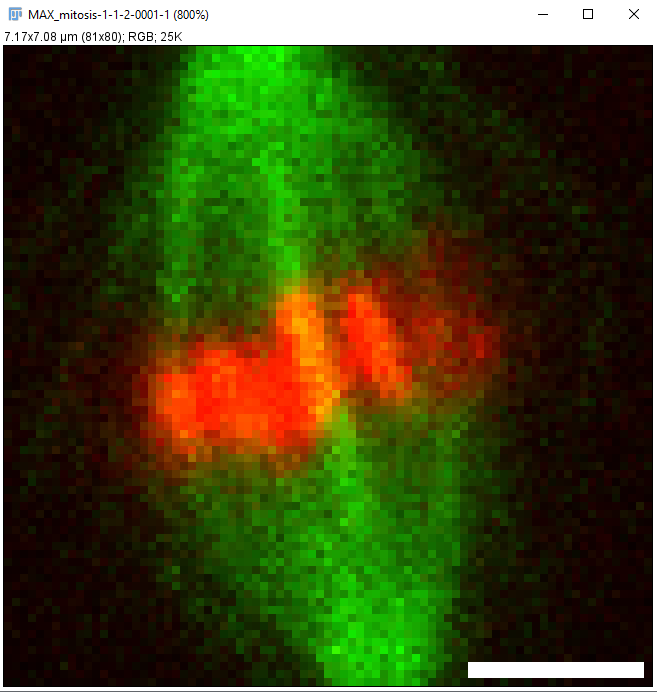
- Put a scale bar on the first of our images (note they were automatically numbered when we split the stack) using "Scale Bar"
- Adjust the setting to make it look good
- This scale bar is currently an "Overlay". This is not sufficient for it to be viewed in a figure.
- Take a look at Overlay options in Image > Overlay
- There are lots of types of overlays you can add, and things you can do with them
- Try "Hide Overlay" and "Show Overlay"
- As an overlay, te scale bar is currently sitting on the image as a separate feature
- Stamp it on by selecting Image > Overlay > Flatten
- This image could now be used outside of ImageJ for a figure
- Save your 4 cropped RGB images, including the flattened image containing a scale bar, and the ROI Manager (this is saved from within the manager using More > Save)
Note: It's not usnusual to lose metadata during image processing steps, requiring you to consult the raw image to acces the scale information and re-apply it using Set Scale.


Note: The spindles in this image are a at a diagonal. You may be tempted to rotate the image to make it more pleasingly straight, but always think about the implications of this. Remember you're dealing with a grid of pixels, so 90° rotations are possible, but anything else can only be acheived by interpolating the image values, altering them to make them fit a new angle. Never do this with images you're analysing. Avoid doing it completely if possible.
Home | << Previous Page | Next Page >>