4. Quantitative measurements
Home | << Previous Page | Next Page >>
Learning Objectives
- Image thresholding
- Binary images
- Particle counting
- Optimising segmentation
- Binary operations
- Image filtering
- Watershedding
- Adding plugins to updates manager
- Labelmap images
- Labelmap analysis
Thesholding
A key step in analysing images is the establishment of which pixels are part of something you're interested, and which are not.
The simplest way to do this is by thresholding.
This basically works on the principle that regions of interest will have higher fluorescence values.
Exercise 1: Thresholding- Open the sample image "Blobs" using the search tool
- Open the Threshold... tool
- Image > Adjust > Theshold
- This image does not have a Dark Background, so deselect this option
- Manually adjust the threshold, making your desired signal appear red
- Click "Apply"
- This has created a binary mask of the thresholded regions
- Hover your cursor over the different areas of the image
- Only two vales now exist, 0 and 255 i.e. yes (this is interesting) and no (this is not)
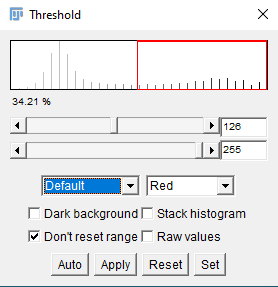
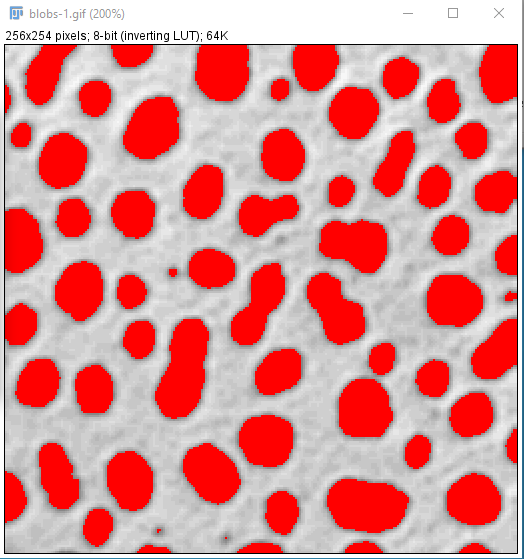
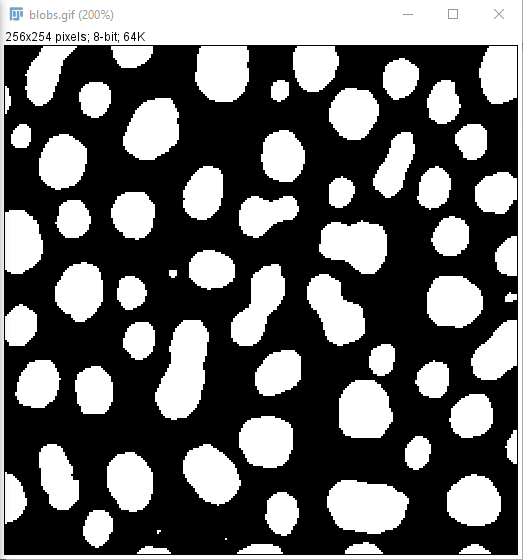
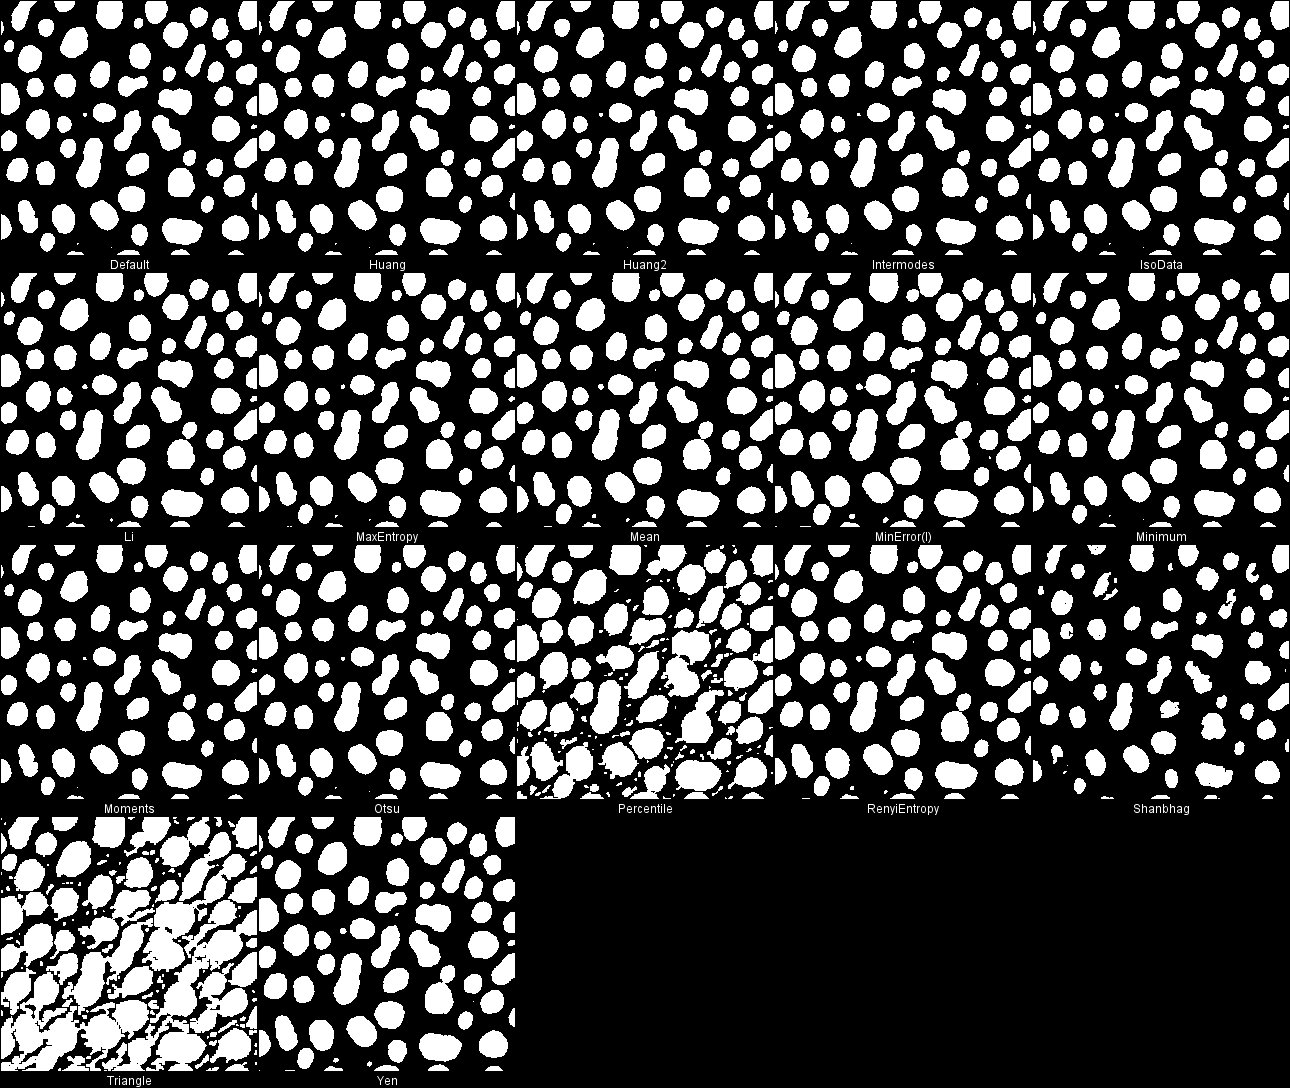
- Thresholding can be performed automatically using a range of different algorithms (you can see these in the "Treshold" tool menu - the default is "Default")
- Many of these exist
- To help decide which is the most effective try "Auto Threshold" and for Method select "Try All" (don't forget to untick "White objects on a black background")
Counting Objects
Now that we have segmented our objects we'd like to know how many there are and what they're like
Exercise 2: Counting- If you don't have a binary image open, then set a threshold on Blobs and Apply it to make one
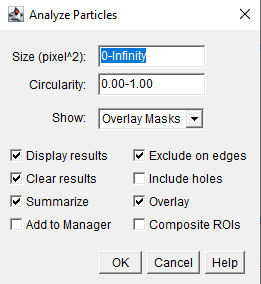
- Open Analyze Particles
- Analyze > Analyze Particles...
- This tool will allow you to count the segmented objects and filter based on size an circularity
- You can filter based on size and circularity
- Options exist to specify what output is wanted
- Experiment with this a bit Note: As with scale bars, if you decorate your image with the output here then it exists as an overlay and can be removed by "Remove Overlay". Alternativey, duplicate images before processing.
- See that one of the "Show" options is for a "Count Mask". Try this and have a look at the output by hovering your curser over the objects
- See that each object has a different value
- This type of image is often called a "Label map" and can be useful when you want to keep track of measurements relating to a given individual object
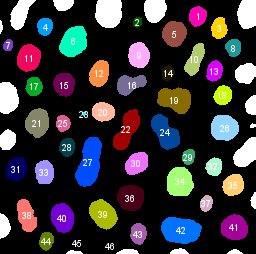
- This has worked reasonably well, but it could be better
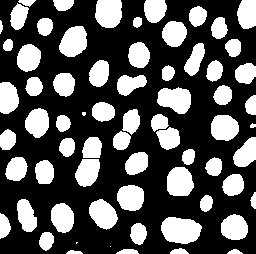
- There are crearly some blobs which are fused together
- Techniques exist to help separate these, known as Watershedding
- The metaphor involves thinking about the image as a topographic map, with the segmented signal being valleys which get deeper the further away they are from the edge
- Boundaries are drawn at the point where the valleys would fuse if they were filled with water
- Several variants of this algorithm exist
- Many standard binary image procesing tools can be found in Process > Binary
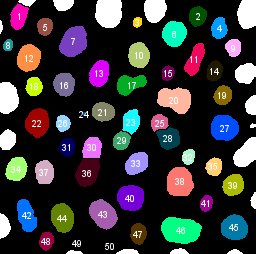
- These include a basic version of "Watershed". Try it out
- That's a bit better. Other variants can be found and installed if you want to explore further e.g. https://imagej.net/plugins/morpholibj, and "https://imagej.net/plugins/interactive-watershed"
 Image copied from https://imagej.net/plugins/interactive-watershed
Set Measurements
The measurements calculated in Analyze Particles are determined within "Set Measurements". Exercise 3:
- Go to your downloaded material and open "DAPI.tif" from "Images"
- We are going to try to automate the following process, so keep the recorder open to help with this
- Threshold this image to try to segment the DAPI-stained nuclei
- Can you use any binary operations (e.g. watershedding) to optimise the segmentation?
- Modify the measurements in "Set Measurements" to calculate the centroid of each particle analysed
- Try to write a macro to perform the entire segmentation task
- Click here for help with this
Machine Learning
Impressive machine learning tools are being developed which can be very useful for bioimage segmentation.
These include Stardist and CellPose.
Exercise 4:- We're going to use Stardist to segment crowded nuclei.
- Necessary plugins must first be installed.
- Help > Update > Manage update sites
- Select CSB Deep and Stardist (to perform segmentation)
- Select SCF MPI CBG and IJPB-plugins (for labelmap processing and analysis)
- Apply changes, then restart Fiji
- Open the same "DAPI.tif" image used previously
- Open Stardist (Plugins > Stardist > Stardist 2D)
- Run using default settings (brace yourself!)
- If you like, try segmenting traditionally for comparison.
- Stardist will work very well for somethings but not everything, so knowing the fundamentals is still valuable... for now.
- The output is a labelmap, not a binary image. This does not work with Analyze Particles.
- Alternatively use Plugins > MorpholibJ > Analyze > Analyze Regions
- If you wanted to look at signal intensties use Plugins > MorpholibJ > Analyze > Intensity Measurements 2D/3D
- Note. We haven't used the SCF MPI CBG plugin yet. This appears as "SCF" in Fiji, and is very useful for creating and manipulating labelmaps, as well as adding more watershedding functions.
Home | << Previous Page | Next Page >>